-- TOC --
散点图就是点,大大小小,各种颜色。下面是个简单的代码示例:
import matplotlib.pyplot as plt
import numpy as np

x = np.linspace(0,1,20)
y = np.sin(x)
z = np.cos(x)
size = tuple(i*300 for i in y)
color = np.random.rand(20)

fig, ax = plt.subplots()
ax.scatter(x,y,color='r',s=size,alpha=0.6)
ax.scatter(x,z,c=color,s=size,linewidth=0,marker='X')

plt.show()
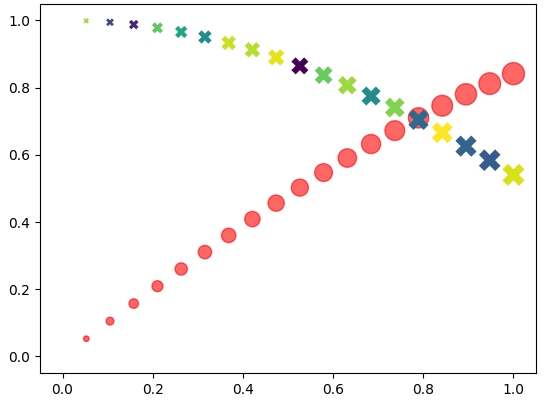
效果图:
s用来指定每个点的sizec和color不能并存,如果用color,所有点的颜色一样,用c可以自定义每个点的颜色alpha表示透明度,取值在0-1之间linewidth表示点的外围线条,设为0就是没有外面的描边了marker用来控制点的形状本文链接:https://cs.pynote.net/sf/python/matplotlib/202309263/
-- EOF --
-- MORE --